Share This
From time to time we may as you to do a datalog of your car. This could be for many reasons, but most likely its because we want to ensure your map is running the way we want it to. So what is a Datalog? A data log is just that, a log of data! The type of data being logged are parameters and information your ECU is using to control your engine. These are things like Engine RPM, Ignition Timing, Engine Load, and Air Fuel Ratio, all of which are logged many times per second and recorded over time. A data log can be made using many tools, but in our case the ECUTEK ProECU tools are we we use to monitor the BRZ/FR-S cars.
Why Would I Need a Datalog?
Keep in mind 99% of our customers are not going to have to worry about sending us logs. The tunes we supply are heavily tested and will provide customers with the performance and smoothness they are looking for. Datalogging comes in handy when enthusiasts with modifications beyond our mapping, aggressive driving styles or living in extreme climates, require maps with an extra level of customization. Providing our in house tuners with an accurate datalog, allows us to see what your engine is doing so we can make these adjustments to make your engine run even better.
Other reasons for creating a datalog, might be because you are experiencing a problem or the car isn't running smoothly. In these cases as long as its repeatable, a datalog can be created to capture what is going on and help us change your map. Other cool benefits of datalogging is that we can sometimes diagnose other problems. These can be physical issues, poorly made intakes, vacuum leaks, bad gas, malfunctioning sensors, and damaged catalytic converters are just a few of things that a high quality datalog can uncover.
How Do I Make A Datalog
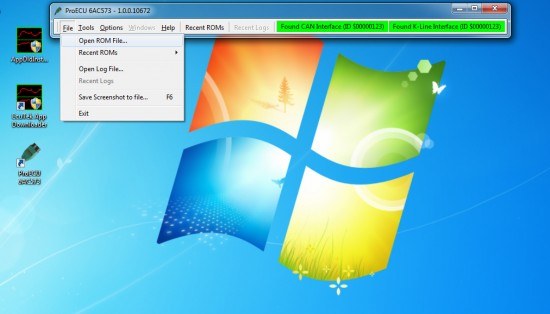
In order to do a datalog you must have your map loaded into ProECU program. To do this, go to File , Open ROM file, then find the correct map you flashed onto your car. You should have been emailed two maps, one with your name and one that is a stock ROM.
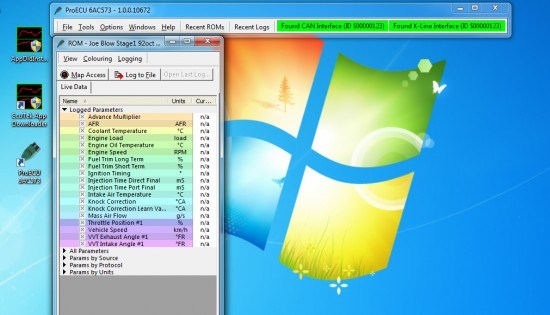
You should see your ROM opened like this showing a bunch of potential live data parameters to view. You can sort through these parameters in a few different ways by clicking on the drop down arrow next to each grouping, or simply view all parameters. Feel free to poke around through them to get familiar with them.
There are more than 100 parameters to log some of which are very useful and some of which are not. You can view as many things as you want, but understand that the more things you log the slower the sample rate as well as its much harder to pin point the actual problem. A good number of parameters to stick to is less than 25. If we ask you for a datalog of your car, please follow the list of parameters that we tell you, as this really helps us with being able to diagnose your issue, or make you map better!
With your list of parameters chosen, click on the MAP Acccess button and you should now see data start to appear and change next to each data parameter. You should also see a small bar across the bottom of the screen scrolling left to right indicating the software is connected. Now your PC is ready to start capturing data!
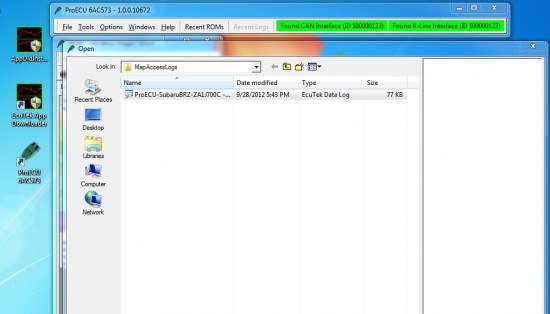
To capture a data log, simply click Log to File to start it, and Log to File to stop it. Each time you do this, a new .CSV file is created and stored on your computer. Each file is created in succession and time stamped so you can keep track of them. These are located in c:Ecutek/MapAccessLogs.
Its as simple as that! The only thing that can take time is setting up the parameters to log. These need to be chosen each time the software is opened up.
What Parameters Do I Log?
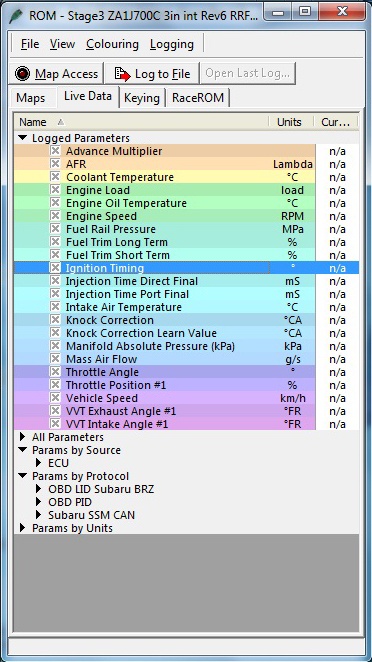
So now the question is what to datalog. Below is a screen shot showing ONLY the items we need. This list is what we normally need to see how your car is running and to be able to accurately re-tune your map. Unless we say other wise, please do not add or subtract form this list as this can make it very hard to see what is happening, or make it very hard to dig through datalogs.
There are a few parameters that look the same as you look through your list. This includes Throttle Position type parameters, load and fueling. Pay close attention to the ones on the list above. For instance, there are a few Engine Loads, but we only need the one that is called Engine Load (load units). Another example is Throttle Position. There are about 14 different ones, but we need the one called Throttle Position #1. If you have questions or can't find the parameters we are asking for, just give us a call and we can help!
What Makes a Good Datalog
Now that you know how to make a datalog, you need to know how to drive the car while logging. The first thing is time. In general we want nice clean short datalogs. That means logs that range from 15seconds to a few minutes are perfect. Logs that are a hour long are hard to dig through to find the info we may be looking for. Its best practice to used the Log to File button just before your run starts, then of course stopping it right after you are done. Making a couple of good logs like this, make it very easy for us to look through, compared to a single 1 hour log.
Tips For Making a Good Datalog
| |
|
|
||
Smooth AccelerationThe key to a good log is a smooth pedal. Slowly moving your accelerator up or down makes reading a datalog much easier. If you are constantly jamming the accelerator on and off during runs makes the data log difficult to read. Secondly pick 3rd gear or 4th gear if you are doing some power type testing. This provides a good amount of load and least amount of wheel spin. |
ConsistencyUse the same gear the same road or same basic conditions. Runs at 32 degrees in the morning and then again 80 degrees in the afternoon will be inconsistent. Using the same roads will also help to produce a consistent datalog. Do not perform a run up hill followed by a run down hill. |
TimeIf you can get the €œarea of concern€ to happen for 10 seconds or more, it will provide excellent data for us to be able to create a new map for you. Secondly is doing a €œrun€ on street starting at 2000RPM then flooring it to legal speeds then stopping the log, is a great way for us to get data to test power. |
||
Logging Examples:
We normally as for a couple of different types of datalogs. First off is full throttle runs. We want these done starting at 2000 RPM in 3rd gear and then full throttle up to redline or your legal speed limit. It is ok to shift to the next gear during these runs, but we prefer to have at least two runs with the 2000RPM to redline being done within a few seconds of each other. This ensures that the engine is good and warmed up.
The second type of run we ask for is more a general type log. This would be starting with the engine fully warmed up and normal driving around. That means idle, cruising, full throttle, and whatever you would normally do driving to work.
Of course this can vary if ask for something specific, or you are capturing something weird happening with your car. Not matter one its, important to follow the above guidelines to ensure we get what we need to make your car better.
What Do I Do With a Datalog?
Simply email the log to us and that is it! The one important thing to help us with is to ensure you email us your mods, reason for your log and name of the map you are running. If we get a regular log with no info, it makes it very hard to help you out. We will then get back to you with a new map to flash onto your car in a day or so.
While you are waiting for us to get back to you, you can also look at the log. One of the nice things about the ECUTEK ProECU software is that it includes a very nice datalog viewer. To view your log, simply open ProECU and to to file, then Open Log File.
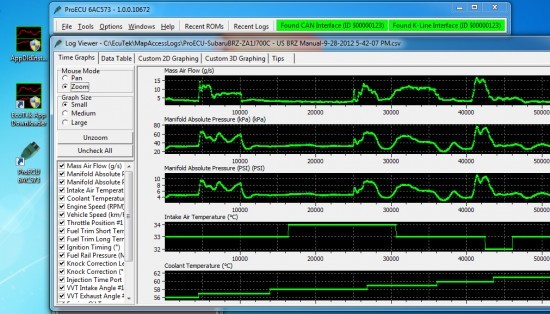
Once your log is loaded there are many ways to view this. The Time Graph method shows all the parameters laid out over time. This is very useful to see a few changes happening at one time. In this mode you can turn on and off parameters and even zoom in on a specific area.
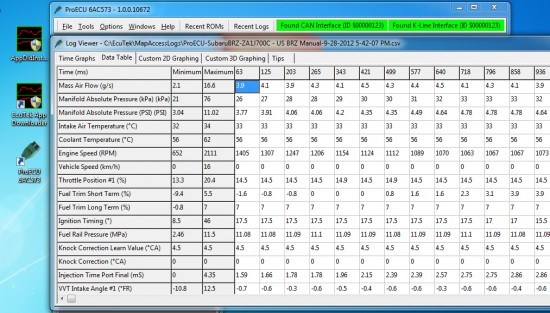
The other method is the data table which has all the hard numbers laid out. Its not very easy for a customer to read, but this is what we use primarily.
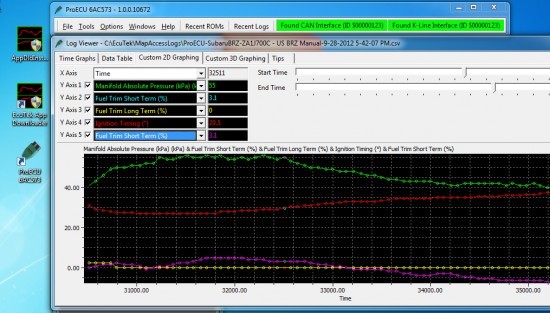
The other really cool one to play with is the 2D graphing. You can pick a few parameters and the start/stop time and overlay them. This is great for dyno tuning to visualize things happening.
There are many many things to play with in the datalog viewing side of things. Most of these things are overkill for 99% of our customers and most likely are never going to be used. So don't feel like you need to learn this side of the software.
Now that you know how to datalog, and know how to make a good one, you just need to email it to us! Please keep in mind there is no reason to send us a log if you car is running fine. Only send us a log if we ask you or if you have an issue. Send all your logs to:


